
How 11 Plus Standardised Scores and Age Weighting Work
Understand 11+ standardised scores and age weighting, with a worked calculation from the published CSSE 2026-entry report. Check which method and qualifying rules apply to your area; a home practice mark cannot predict an official result.
 Elspeth Marlow
- 14 min read
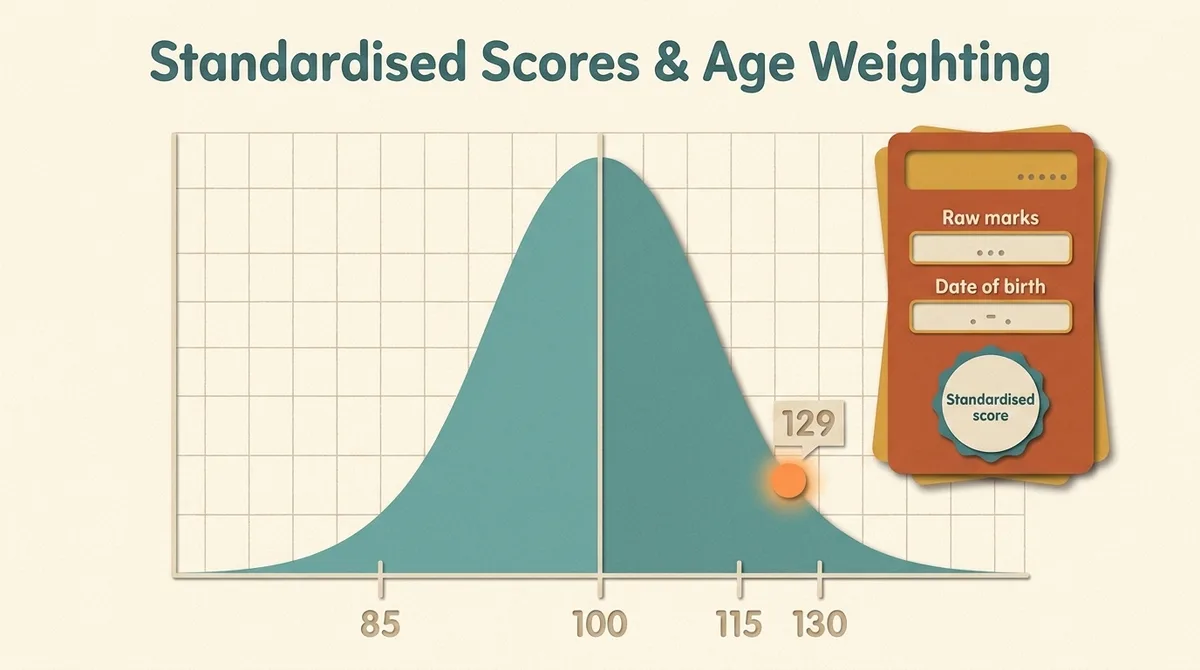
Your child comes home from an 11 plus paper and says they got 38 out of 50. That number, on its own, tells you almost nothing. It will be converted into something called a standardised score, and that conversion depends on how hard the paper turned out to be, how the rest of the cohort performed, and, in most areas, exactly how old your child was on the day of the test. A child who scores 38 in September and a child who scores 38 in a different year can end up with very different standardised scores.
That uncertainty is why so many parents go looking for an 11 plus standardised score calculator. The problem is that almost every calculator you will find is guessing. One of the most visible ones states plainly in its own small print that the methodology is not published, so it uses "reasonable assumptions about mean scores, standard deviations, and age adjustment factors". Another popular page tells parents that CSSE tests "are not age-standardized", which is simply not true, and it applies no age adjustment at all as a result.
CSSE publishes standardisation reports on its Freedom of Information page. The exact formula, that year's mean and standard deviation for each paper, and the per-day age adjustment coefficients are all in a public PDF. This guide uses those numbers. Where a figure is published fact we say so and link the source; where something is an estimate we label it an estimate. That distinction matters more than any calculator interface.
How do you work out your child's standardised score?
You can do this by hand in about two minutes. Which method you use depends on your region, because 11 plus formats and scoring differ significantly across England.
If your child sat the CSSE paper in Essex (2025 test, 2026 entry), use the published figures. The 2026 Entry Standardisation Report gives these cohort statistics for the 5,113 candidates: English raw mean 34.98670057 with a standard deviation of 7.614091721, and Maths raw mean 27.30021514 with a standard deviation of 13.07618947. Then:
- Standardise each paper on its own: subtract that paper's mean from your child's raw mark, divide by that paper's standard deviation, multiply by 15, then add 100.
- Work out "days younger": your child's date of birth minus 01/09/2014.
- Add the age allowance to each paper. Multiply days younger by 0.016617024 for English and by 0.00894304 for Maths, then add each result to the matching standardised score.
- Add the two adjusted scores together and multiply by 1.5. That is the total score CSSE uses.
Or let the calculator below do the arithmetic, using the same published 2026 entry figures.
This part of the guide is a score calculator. It works in your browser.
For other tests, use the method published by the admission authority. GL Assessment explains standard age scores for its nationally standardised school assessments, such as NVR. Those reference norms are not a raw-mark conversion table for every selective 11+ test (GL Assessment score guidance). A selective test can use its own reference group, subject weights and score range.
Without the relevant conversion and age adjustment, you cannot turn a home practice percentage into the official result. Guessing the mean and spread produces a mathematical illustration, not an admissions forecast. Our 11+ score calculator by area uses published methods and thresholds, and explains where a calculation is unavailable.
The CSSE example above applies only to the named 2025 test cohort for 2026 entry. Do not apply those coefficients to another paper or year.
What does a standardised score actually measure?
A standardised score expresses performance relative to the reference group used for that test. Where the test is age-standardised, it also allows for age differences. The reference group may be a national sample or an admissions cohort; check the provider’s explanation.
It deliberately throws away the raw mark, because the raw mark is contaminated by things that have nothing to do with your child. A paper with an unusually tricky comprehension will produce lower raw marks across the whole cohort. Standardising rescales every result against that year's actual performance, so a 38 on a hard paper and a 44 on an easy paper can land in the same place. This is why raw marks are almost never published and why comparing your child's mock mark to a friend's mock mark from a different provider tells you very little.
GL’s NVR school-assessment guidance describes a national reference scale with an average of 100 and a standard deviation of 15. It explains why scores in that assessment are clustered around the average. A local 11+ total or weighted score can use a different scale.
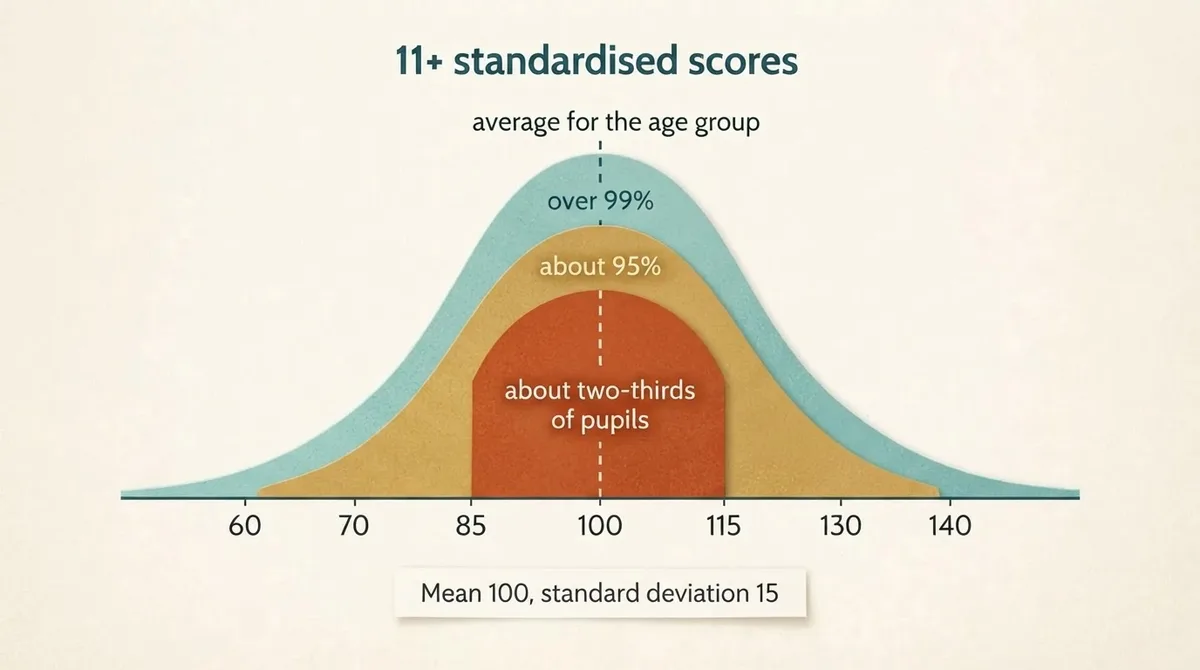
Read the scale on your child’s results letter before interpreting a number. Neither a national reference curve nor a raw practice percentage tells you whether a particular school will offer a place.
Why does the 11 plus adjust scores for your child's age?
Children born in August sit the same paper as children born the previous September, and there is nearly a full year of development between them. GL Assessment puts it plainly: the oldest pupils in a class are very nearly twelve months older than the youngest and typically achieve higher raw scores (GL Assessment). Without a correction, the 11 plus would systematically select older children.
So boards compare each child only with others of the same age. GL does this by building age bands into its norms, which is why an older pupil can post a higher raw score than a younger pupil and still receive a lower standardised score. Buckinghamshire Council describes the same principle for its secondary transfer test: each child's score is standardised to account for their age when the test was taken, then weighted according to the different sections (Buckinghamshire Council).
CSSE does it differently and, unusually, transparently. Rather than baking age into the norms, it standardises each paper first and then adds an explicit allowance per day of age. It also does not assume the adjustment is needed. The published report says a statistical test was used to assess whether age adjustment was necessary to take account of any apparent bias against younger candidates. For the 2025 test the result was statistically significant for both English and Maths, so coefficients were calculated for both papers.
That is worth pausing on, because it directly contradicts one of the pages currently ranking for this search. CSSE tests are age standardised. The board says so in writing, publishes the coefficients, and explains the test it uses to decide whether to apply them.
What happens when two children get the same marks but different birthdays?
This is where the published coefficients stop being an abstraction. The example below is our own, worked from the figures in the CSSE report.
Two children sit the 2025 CSSE paper for 2026 entry. Both get exactly average raw marks in English and exactly average raw marks in Maths. Their papers, mark for mark, are identical.
The first child was born on 1 September 2014, the oldest possible date in the year group. Average raw marks standardise to 100 on each paper. She is zero days younger than the reference date, so she gets no age allowance. Her total is 1.5 multiplied by (100 plus 100), which is 300. CSSE confirms exactly this in its report: a candidate born on 01/09/2014 with average marks on each paper obtains a total of 300.
The second child was born on 31 August 2015, the youngest possible date. He also standardises to 100 on each paper. But he is 364 days younger, so:
- English allowance: 364 multiplied by 0.016617024, which is about 6.05 points
- Maths allowance: 364 multiplied by 0.00894304, which is about 3.26 points
- Adjusted papers: about 106.05 and about 103.26
- Total: 1.5 multiplied by about 209.31, which is about 314
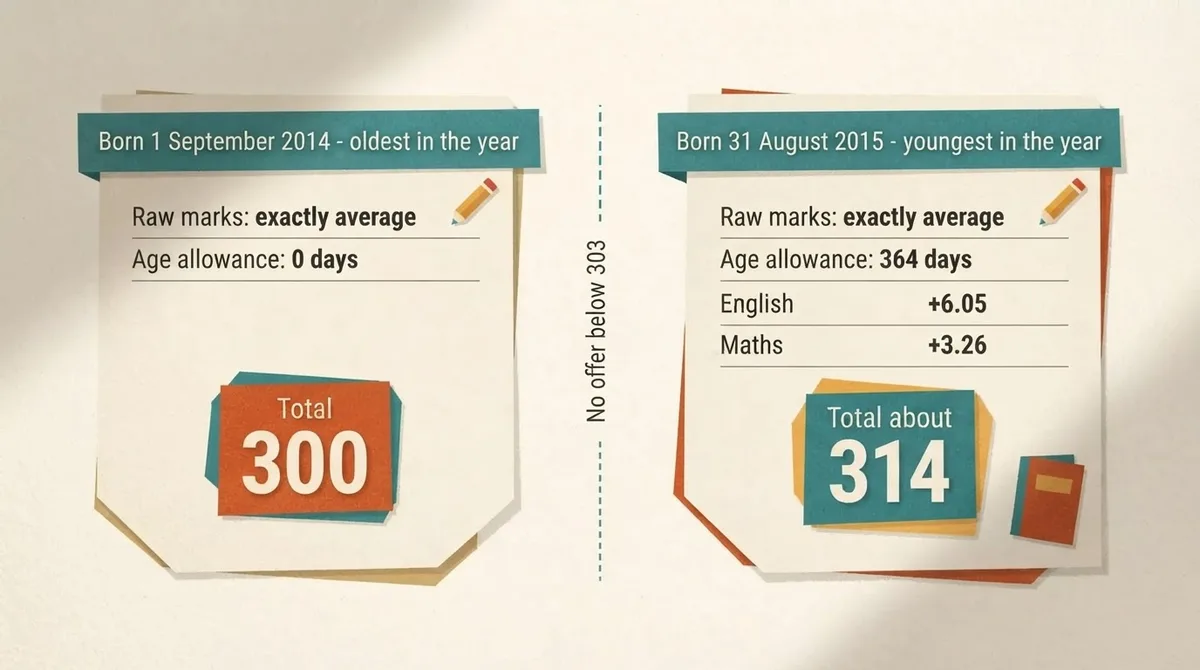
Now read the threshold. CSSE states that secondary school offers are not made to any child scoring under a total standardised score of 303, with successful appeals and special consideration places falling outside that criterion (CSSE guidance for 2026 entry).
Identical papers. The older child, on 300, falls below the minimum standard. The younger child, on roughly 314, clears it. That is the entire case for age weighting in a single comparison, and it also explains why a summer-born child's result often surprises parents in a good way.
One caution: the coefficients change every year, because they are recalculated from that year's cohort. Do not carry the 2025 numbers into a future paper. Check the CSSE Freedom of Information page for the current report before you calculate anything.
Can an 11+ score tell you a national percentile?
Only when the provider supplies a valid percentile interpretation for that assessment and reference group. GL’s national percentile ranks for its school assessments compare pupils with the assessment’s national sample. They are not a universal lookup for selective entrance-test scores.
A score of 129 on a national 100-centred scale and a score of 129 in a local admissions system need not mean the same thing. Use a percentile printed on the report or published for the specific test. For admissions, check the area’s qualification rule and the school’s oversubscription policy separately. Our guide to 11+ pass marks and qualifying scores by area explains that distinction.
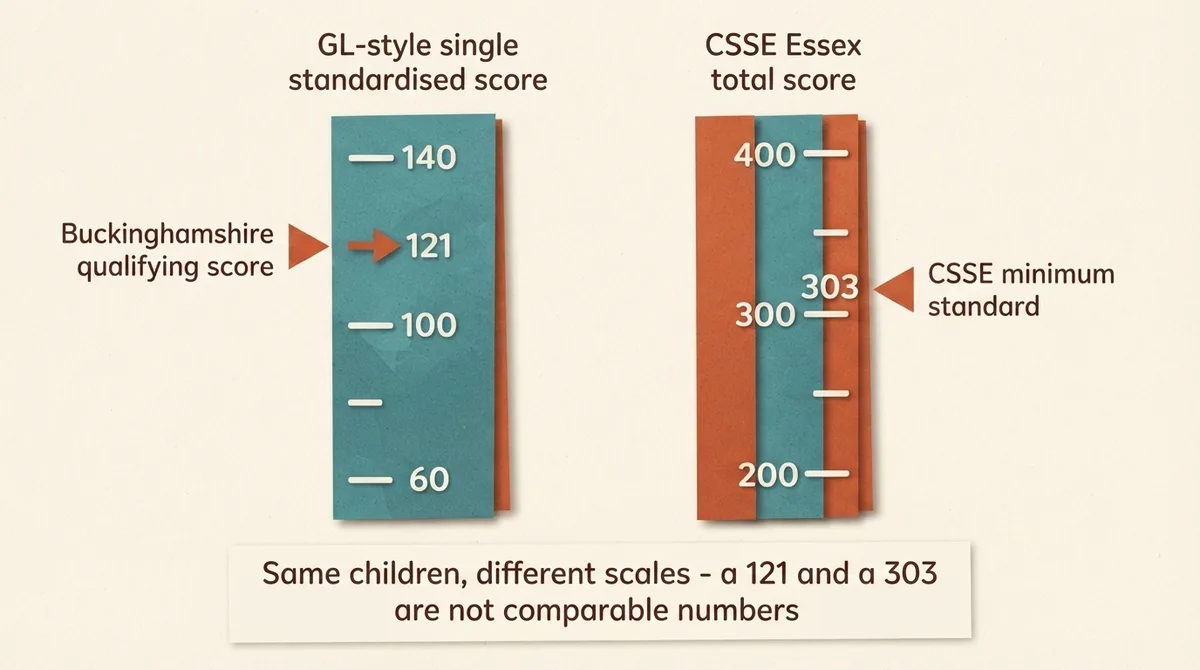
Why can't you compare a 121 with a 303?
This is the most common confusion we see, and it is worth stating bluntly: different areas use different scales, not different difficulty levels.
Buckinghamshire produces one standardised score across the whole test, and states that children who achieve a standardised score of at least 121 are eligible to be considered for a Buckinghamshire grammar school place. That number lives on the familiar 100-average scale.
CSSE produces a total built from two standardised papers, each already on the 100 scale, added together and multiplied by 1.5. An exactly average child lands on 300, so the numbers naturally run in the low hundreds of the three-hundreds. A 303 is not a harder or easier achievement than a 121 in any straightforward sense. It is a different unit.
It is also worth knowing that in Essex, clearing 303 does not mean an offer. For 2025 entry the score of the last selective place offered on National Offer Day varied enormously by school: King Edward VI Grammar was 355 inside the priority area and 372 outside, Colchester Royal Grammar was 343, Colchester County High for Girls was 322 and 333, Westcliff High for Boys was 309 and 351, and Southend High for Girls was 303 and 321. If you are in Essex, our guide to what makes the CSSE exam different covers the format alongside the scoring.
Why do most 11 plus score calculators give you the wrong number?
Three reasons, in order of how much damage they do.
They invent the mean and standard deviation. Standardisation is meaningless without the cohort statistics. A calculator that does not tell you which mean and which standard deviation it used is not calculating anything, it is generating a plausible-looking number. Ask any tool to show its inputs.
They skip age adjustment or apply the wrong one. Some tools drop it entirely on the false premise that CSSE does not age standardise. Others apply a generic monthly adjustment borrowed from a different board. For CSSE in 2025, the per-day English coefficient is nearly twice the Maths coefficient, so a flat adjustment across both papers is wrong even when the total is roughly right.
They reuse last year's numbers silently. Because the mean, standard deviation and coefficients are recalculated annually, a calculator hard-coded to an old paper drifts further from reality every year without ever warning you.
Our test for any calculator, including our own: can you see the year, the source, and the exact figures, and could you reproduce the result on paper? If not, treat the output as a rough indication only.
What should you do with your child's score now?
A score is a snapshot. Repeated practice can help you see progress when the papers have comparable difficulty, format and marking. Keep the conditions consistent and review the questions your child found difficult; scores from different mock providers are not automatically comparable.
- Score the papers consistently. Use the same time limits and the same marking rules every time, or you are comparing incomparable things. Our guidance on 11 plus mock exams covers how to run them so the numbers mean something.
- Look at the sections, not the total. A total of 112 hides the difference between a child who is even across all papers and one who is strong in English and weak in non-verbal reasoning. The second child has an obvious next step; the first does not.
- Check the local threshold, then work backwards. If your area qualifies at 121 and your child is scoring 112 in December, that is a gap of roughly two thirds of a standard deviation, which is a realistic term's work on one or two weak areas rather than a wholesale rethink.
- Do not over-read summer birthdays. The age allowance is already in the score. Once standardised, your August-born child has been compared fairly; there is no further discount to apply mentally.
If you want the trend tracked for you rather than kept in a notebook, Trace Learn's progress tracking records standardised-style scores across every practice paper so you can see whether the line is moving.
Frequently asked questions
How is an 11 plus standardised score calculated?
The method depends on the test. CSSE’s named 2025 report standardises each paper using its cohort mean and spread, adds the published per-day age allowance, then multiplies the two-paper total by 1.5. Other providers can use age-specific conversion tables and different weightings. Use the method for the correct test and year.
What is a good score on the 11 plus?
Check the qualifying rule for the relevant area, then the allocation rules for each school. Qualification and an offer are separate decisions. A higher score matters in a score-ranked policy; in another policy, priority area or distance may decide between qualified applicants.
Is 129 a good 11 plus score?
It depends on the test’s scale and the school’s rules. Compare 129 with the qualifying score for that specific test. Do not assign it a national percentile unless the provider publishes one for the assessment, and do not treat qualification as a guaranteed offer.
What is the standardised age score for 11 plus exams?
Age-standardisation allows for the age differences within a school year. The reference scale and any combined total depend on the assessment. GL’s national school-assessment norms and a local selective-test result are not interchangeable.
Are CSSE tests age standardised?
Yes. Some widely shared pages claim otherwise, but CSSE's own published standardisation report describes the statistical test it uses to decide whether age adjustment is needed and gives the per-day coefficients applied for each paper. For the 2025 test, adjustment was applied to both English and Maths.
Can I work out my child's exact score before results day?
Only if the necessary method, marks and age adjustments for that exact cohort are available. A previous CSSE report cannot predict a later test result. For other areas, use the official results letter and current published guidance; the score calculator explains which methods are available.
If you are still building towards the test rather than decoding a result, our overview of how the 11 plus works is the better starting point, and you can start a free account to see how your child's practice scores track over a term.
Topics
- standardised scores
- csse
- gl assessment
- age weighting
- results